|
|
|
Home | Pregnancy Timeline | News Alerts |News Archive Jun 23, 2015

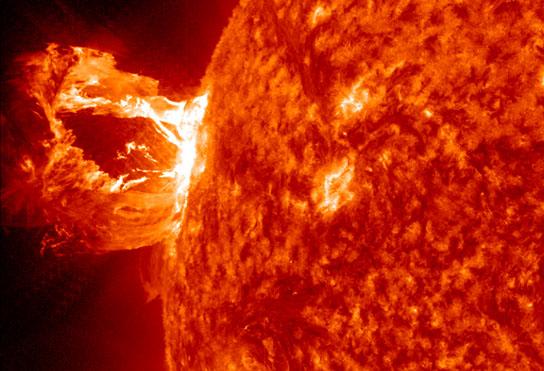
ABOVE: A coronal mass is hurled from the sun. Image Credit: NASA
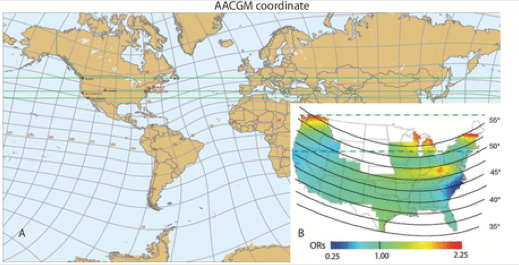
BELOW: Altitude Adjusted Corrected Geo-Magnetic (AACGM) coordinates 23 in grey lines overlaying Earth's continents with country boundaries. RED numbers indicate the latitude and longitude of AACGM.
GREEN LINES - Geographic latitudes and longitudes are parallel to the x and y-axes, respectively. The
USA shares the same geographic latitudes as southern Europe and north Africa. The northern USA shares
the same geomagnetic latitudes as northern Europe. (B) Inset shows AACGM latitudes (solid black lines)
overlaying spatial variation in RA risk in the USA. Image Credit: Environmental Health Perspectives.

|
|
|
|
|
|
Sun's coronal gases may harm our health
Husband and wife scientists have observed an unusual phenomenon. They have revealed a "highly significant" match between solar storms and incidents of human disease: rheumatoid arthritis (RA) and giant cell arteritis (GCA), both autoimmune disorders.
Lisa Rider is a Deputy Unit Chief of the Environmental Autoimmunity Group located in the National Institutes of Health. Her husband is Simon Wing, a Johns Hopkins University physicist. As part of Rider's job reviewing data, she noticed a curiosity coming from the Mayo Clinic in Rochester, Minnesota, data revealed the number of cases of RA and GCA were following approximately 10-year cycles. Rider showed her husband the phenomenon to get a physicist's opinion. Wing recalled thinking: "Only a few things in nature have a periodicity of about 10-11 years — and the solar cycle is one of them."
Wing teamed up with physicist Jay Johnson, his long-time collaborator, from the U.S. Department of Energy's Princeton Plasma Physics Laboratory, to investigate further. The two physicists tracked the incidence of RA and GCA cases compiled by the Mayo Clinic. The evidence suggested "more than a coincidental connection," according to Eric Matteson, Chair of the Division of Rheumatology at the Mayo Clinic who became a coauthor on the paper.
Simon Wing became first author and Lisa Rider coauthor on the research work that ensued. Their data drew upon previous space physics research supported by the Department Of Energy (DOE) Office of Science, and was published in BMJ Open (formerly the British Medical Journal).
RA and GCA are autoimmune conditions in which the body mistakenly attacks its own organs and tissues. RA inflames and swells joints and can cause crippling damage if left untreated. In GCA, the autoimmune disease results in inflammation of arterial walls, leading to headaches, jaw pain, vision problems and even blindness in severe cases.
Incidents of RA and GCA were in concert with the cycle of magnetic activity of the sun. During a solar cycle, dramatic changes on the sun can affect space weather near Earth. At the solar maximum, for example, an increased number of outbursts called coronal mass ejections hurl millions of tons of magnetic and electrically charged plasma gases against the magnetosphere surrounding Earth.
These geomagnetic disturbances can disrupt cell phone service, damage satellites and even knock out power grids. During the declining phase of these high-speed solar streams, a wind develops flowing from the sun and made up of plasma gases. This is called 'solar wind' and continuously increases geomagnetic activity at our higher latitudes.
The research tracked correlations between the two diseases along with geomagnetic activity and extreme ultraviolet (EUV) solar radiation. The physicists focused on cases recorded in Olmsted County, Minnesota — home of the Mayo Clinic for more than fifty years — and compared their data with indices of EUV radiation from 1950 through 2007 and indices of geomagnetic activity from 1966 through 2007. The results included all 207 cases of GCA, and a total of 1,179 RA cases occurring in Olmsted County during those years. The study was led by Sherine Gabriel, then of the Mayo Clinic and now dean of Rutgers Robert Wood Johnson Medical School.
Correlations show strong evidence between both diseases and geomagnetic activity. GCA incidents regularly peaked within one year of the most intense geomagnetic activity, while RA incidents within one year of the least intense activity. Correlations with extreme ultraviolet (EUV) solar radiation was less strong — and had a significantly longer response time.
These findings were consistent with previous studies of geographic distribution of RA cases around the United States. This research revealed greater incidents of RA in sections of the country more affected by geomagnetic activity. The heaviest incidences followed along the high geomagnetic latitude lines on the East Coast which were below those on the West Coast. Although Washington, DC lies just 1 degree farther north than San Francisco, DC is 7 degrees farther north in terms of geomagnetic latitude.
While making no claim to an exact explanation of cause, the authors identified five characteristics of disease occurrence not obviously explained by any other leading hypotheses. The authors suggest possible causal pathways are (1) reduced production of the hormone melatonin which acts as an anti-inflammatory with immune-enhancing benefits, and (2) an increased formation of free radicals in some susceptible individuals.
A study of 142 electrical power workers found that their melatonin levels were reduced by 21% on days with increased geomagnetic activity — supportting the results of the study.
Confirming a causal link between outbreaks of RA and GCA with geomagnetic activity would help begin mitigating its impact. Strategies might include relocating to lower latitudes or developing methods to counteract geomagnetic activity.
For now, the authors say their findings warrant continued investigation over longer time periods, more locations and even more autoimmune diseases.
Abstract
Objective To examine the influence of solar cycle and geomagnetic effects on the incidence of giant cell arteritis (GCA) and rheumatoid arthritis (RA).
Methods We used data from patients with GCA (1950–2004) and RA (1955–2007) obtained from population-based cohorts. Yearly trends in age-adjusted and sex-adjusted incidence were correlated with the F10.7 index (solar radiation at 10.7 cm wavelength, a proxy for the solar extreme ultraviolet radiation) and AL index (a proxy for the westward auroral electrojet and a measure of geomagnetic activity). Fourier analysis was performed on AL, F10.7, and GCA and RA incidence rates.
Results The correlation of GCA incidence with AL is highly significant: GCA incidence peaks 0–1 year after the AL reaches its minimum (ie, auroral electrojet reaches a maximum). The correlation of RA incidence with AL is also highly significant. RA incidence rates are lowest 5–7 years after AL reaches maximum. AL, GCA and RA incidence power spectra are similar: they have a main peak (periodicity) at about 10 years and a minor peak at 4–5 years. However, the RA incidence power spectrum main peak is broader (8–11 years), which partly explains the lower correlation between RA onset and AL. The auroral electrojets may be linked to the decline of RA incidence more strongly than the onset of RA. The incidences of RA and GCA are aligned in geomagnetic latitude.
Conclusions AL and the incidences of GCA and RA all have a major periodicity of about 10 years and a secondary periodicity at 4–5 years. Geomagnetic activity may explain the temporal and spatial variations, including east-west skewness in geographic coordinates, in GCA and RA incidence, although the mechanism is unknown. The link with solar, geospace and atmospheric parameters need to be investigated. These novel findings warrant examination in other populations and with other autoimmune diseases.
About
PPPL, on Princeton University's Forrestal Campus in Plainsboro, N.J., is devoted to creating new knowledge about the physics of plasmas -- ultra-hot, charged gases -- and to developing practical solutions for the creation of fusion energy. Results of PPPL research have ranged from a portable nuclear materials detector for anti-terrorist use to universally employed computer codes for analyzing and predicting the outcome of fusion experiments. The Laboratory is managed by the University for the U.S. Department of Energy's Office of Science, which is the largest single supporter of basic research in the physical sciences in the United States, and is working to address some of the most pressing challenges of our time. For more information, please visit science.energy.gov.
Return to top of page
|

